Data Catalogs
Written By Natalia
Last updated Over 1 year ago
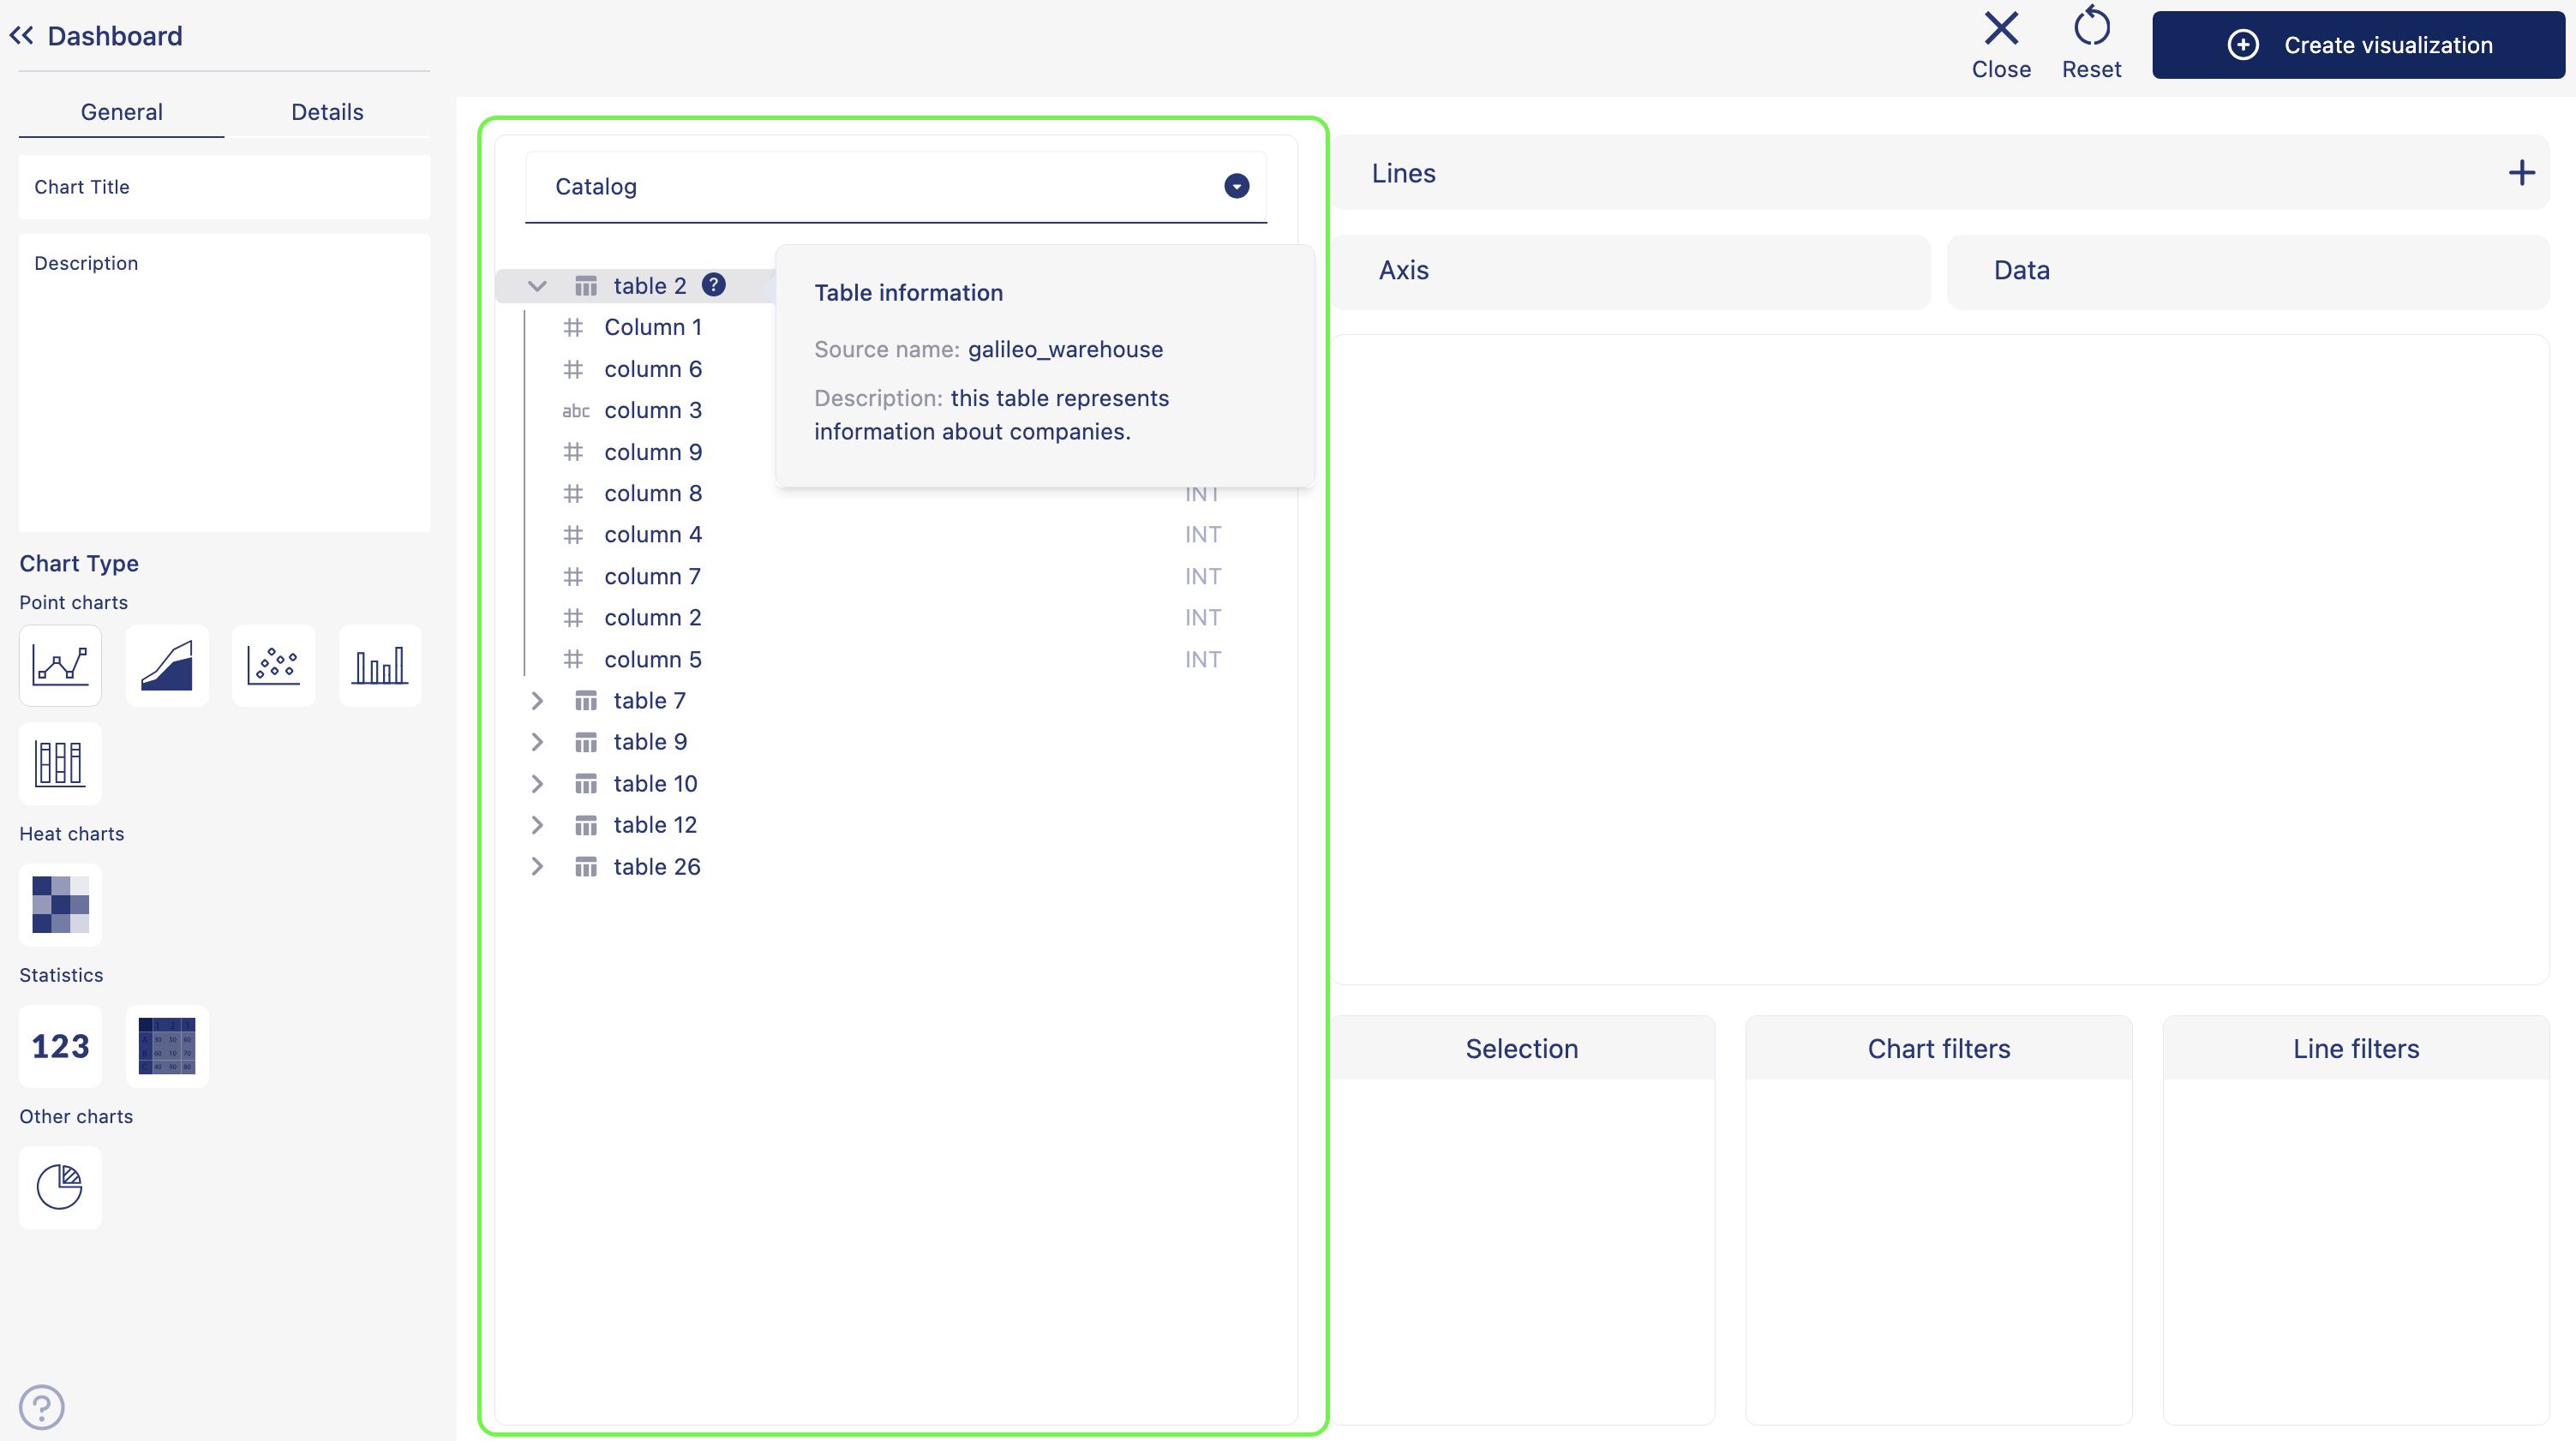
A catalog provides a complete picture, which helps to increase data visibility, trust and discoverability of the data by all users. You will find and use the catalog in the visualizations creating the option to choose the dataset you want to use for creating visualizations. Catalog displays the table and the column names, where you can also see the details about the table and the column by hovering over the table or column name and placing the cursor over the '?' icon.
Create a catalog
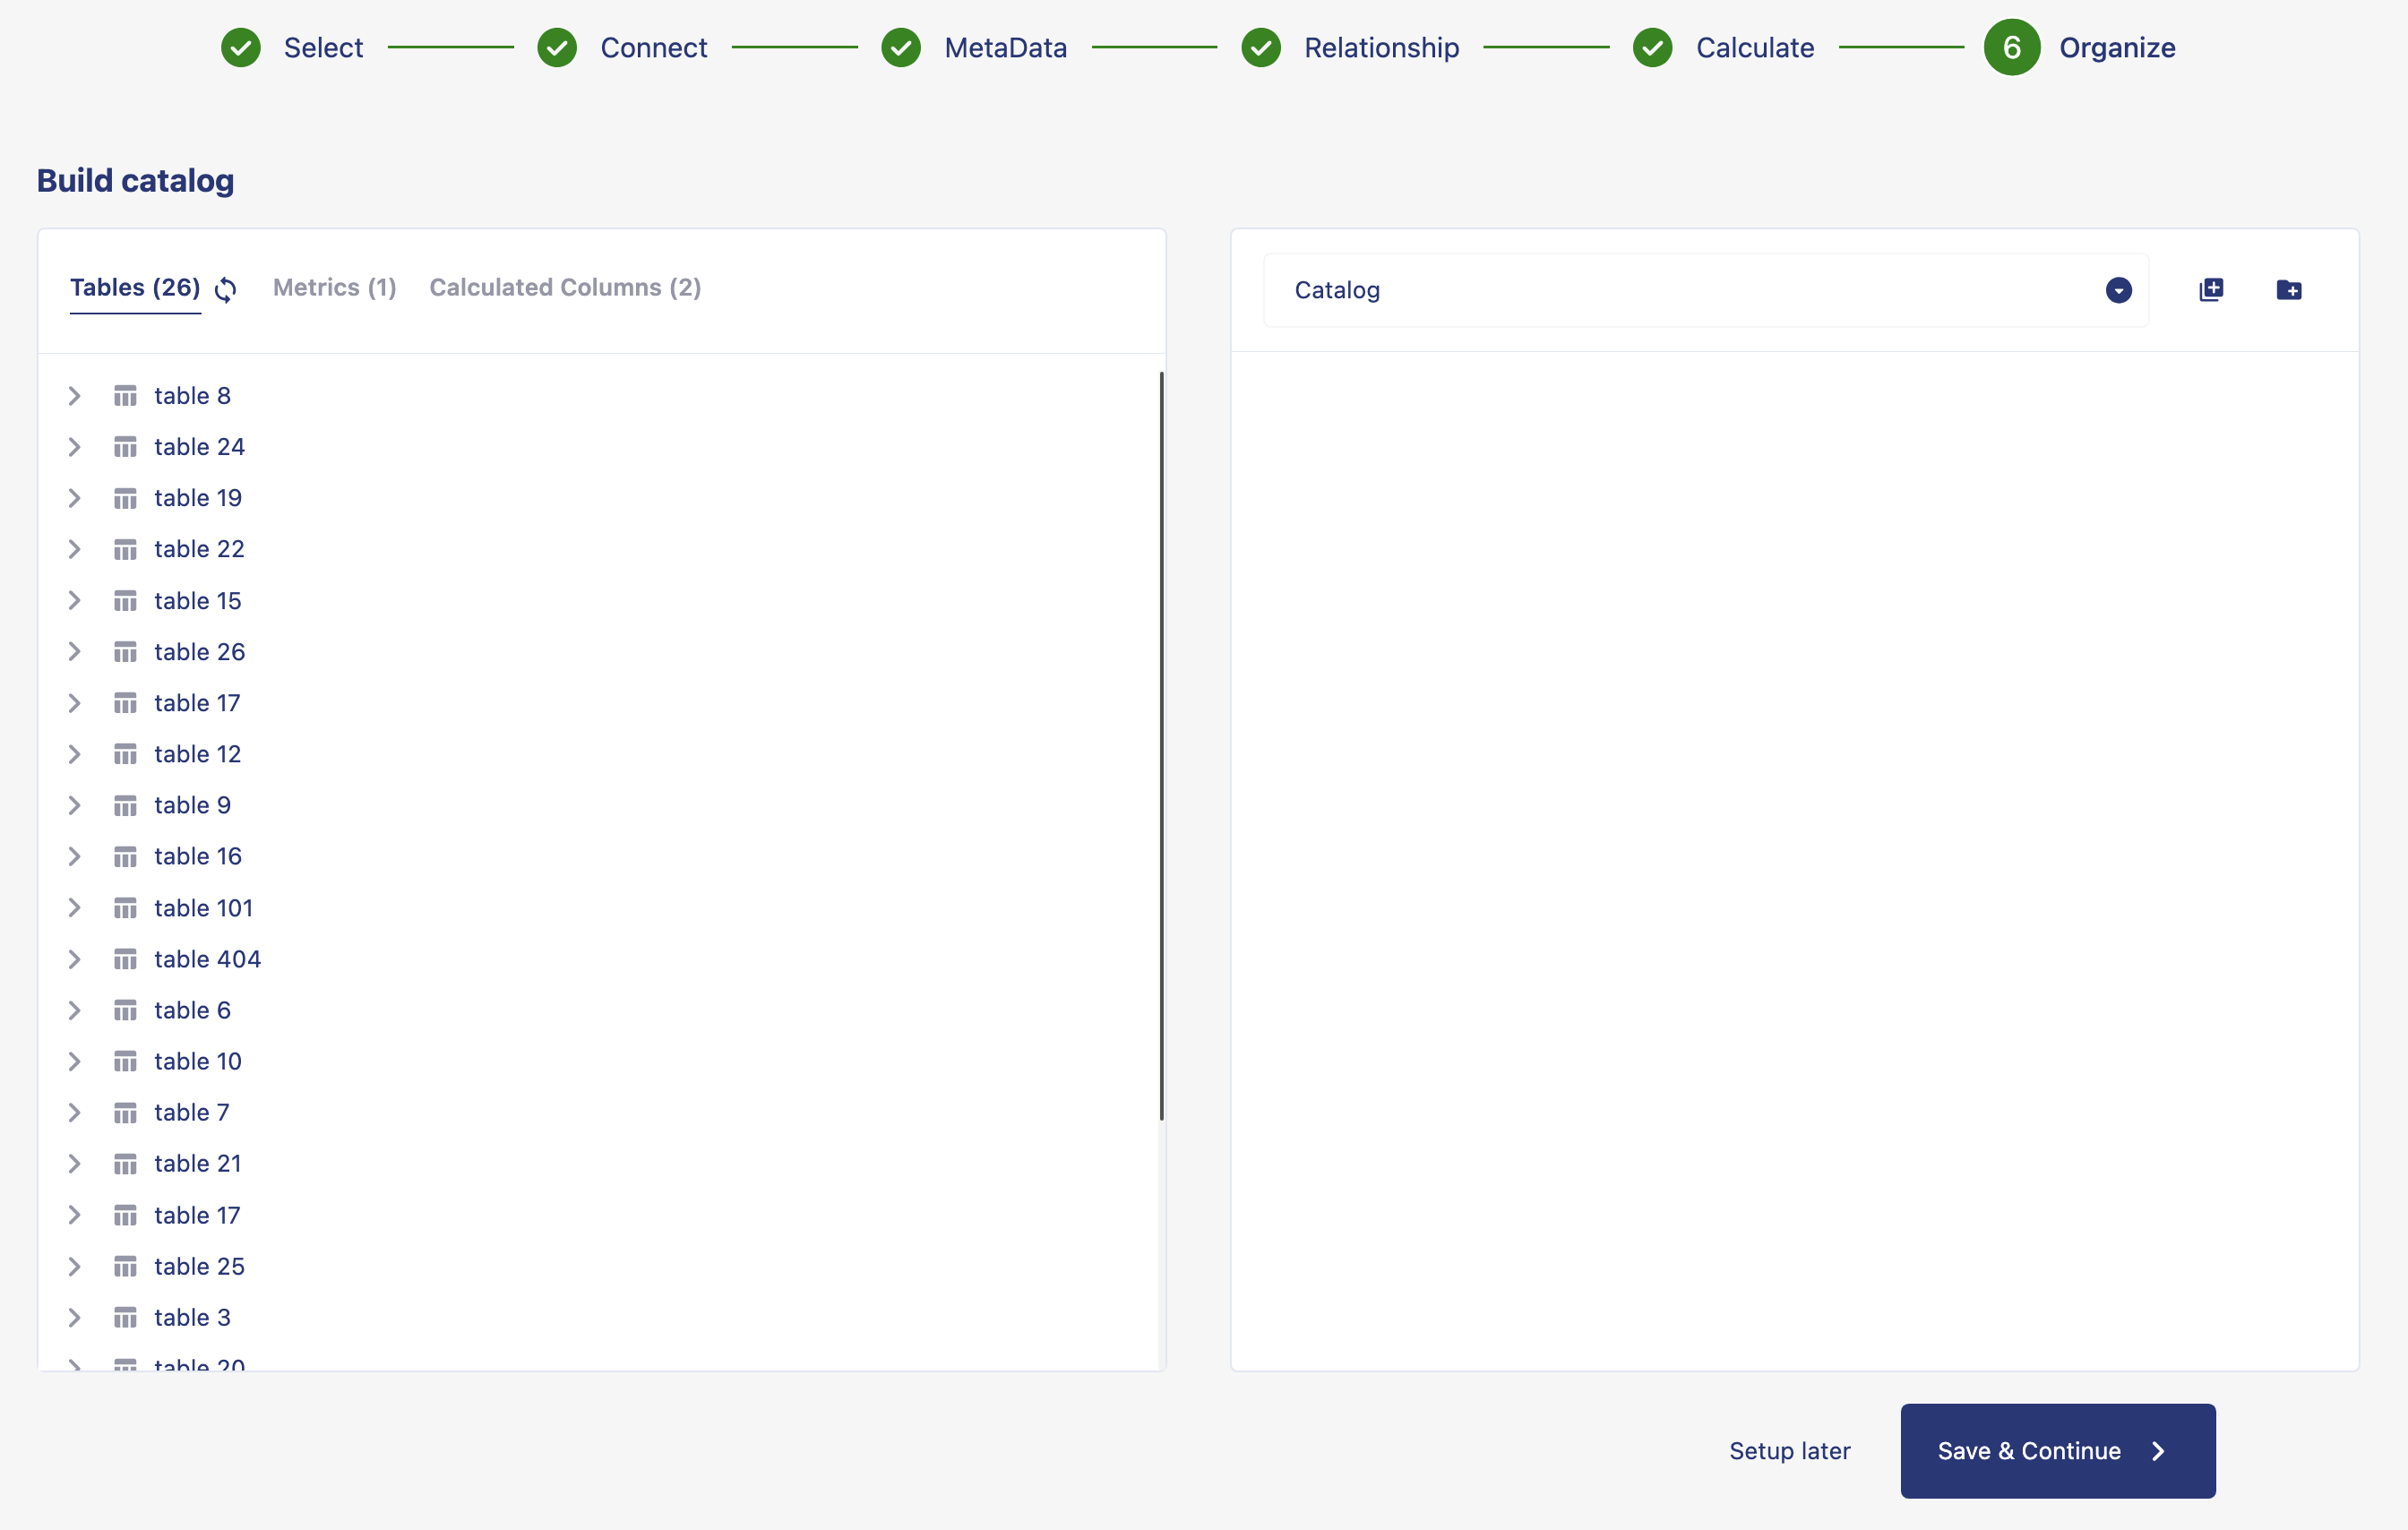
When you are adding a new connection, once you have completed the steps of connecting data warehouse, adding meta data, create relationship and create formulas with your data and click on save and continue, you will see the option to organize your data into a catalog. If you want to create a catalog from already existing data connection, go to edit catalog page.
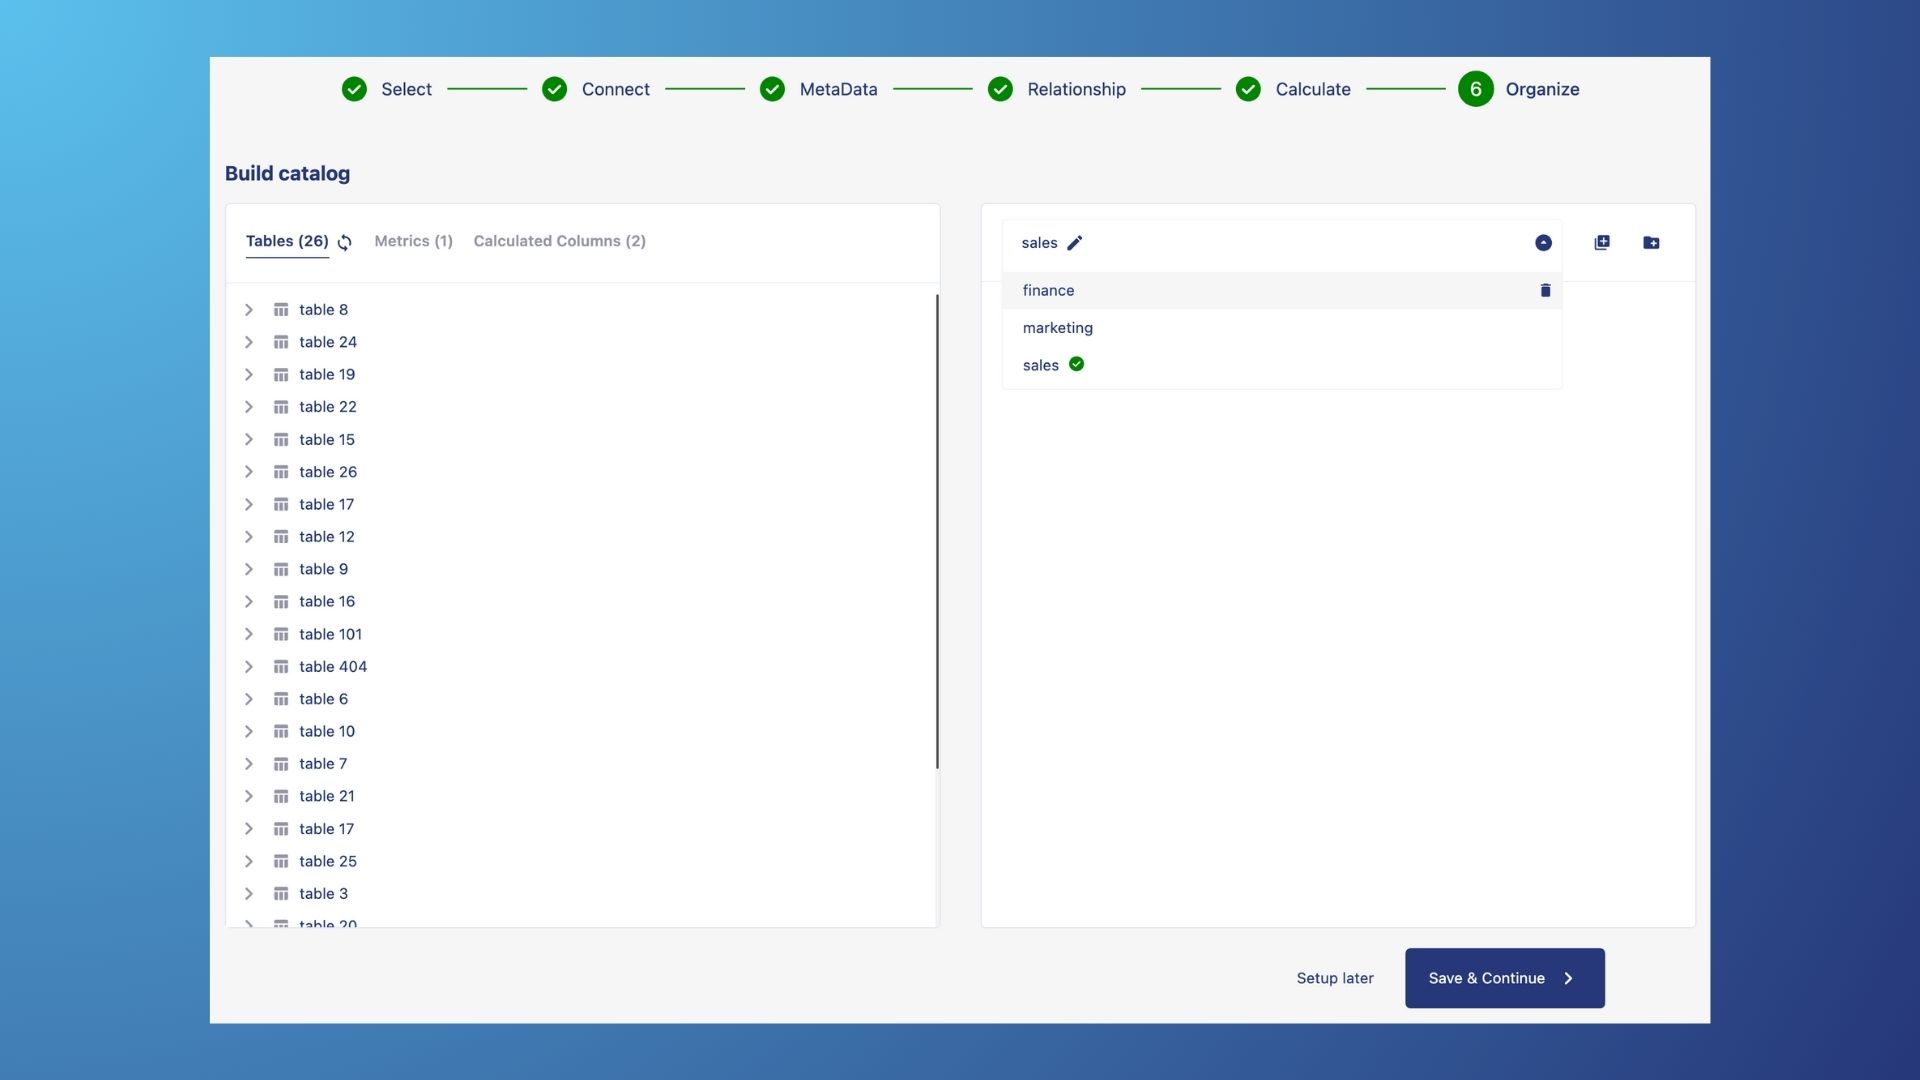
When you are in the organize page you will see two containers. Container on the left hand side displays the data tables from the source you have connected, metrics and calculated columns. With the refresh 🔄 icon, you can update the list. Container on the right hand side represents the data catalog. The dropdown icon allows you to choose between catalogs, + icon allows you to create a new catalog, and the folder icon allows you to add folder inside the catalog.
Below are the steps how you can create your catalog:
Click on the
add catalogicon to create a new catalog. Click on thepen iconto name the catalog. Click and hold on thetable namefrom the list of tables on the left container. Drag and drop the table into the right side catalog container. This will add the table and all the columns within the table into the catalog.If you want to add just a column but not entire table from your source to the catalog. Click on the
nameof the table from the table list. Click and hold on thecolumn namethat you want to drag into your catalog, then drag the column into the catalog container. You can drag and drop a column into a table, folder or independent without a table or folder in a catalog.Click on the
add foldericon in the catalog to add a folder and give a name to your folder. Drag and drop tables or cloumns into the folder. Hoever over a floder name in the catalog, click onadd foldericon to add a sub-folder, or you can drag and drop a folder into another folder to make it a sub-folder. Drag and drop a sub-folder from within a folder to catalog to make it a folder. Clik onsave & continueto save your catalog.
Edit a catalog
You can organize or edit catalog from the source overview page.
Follow these steps to organize or edit the catalog:
Click on name of the workspace. Click on settings. Click on sources from the sidebar. From the overview of the connectors, click on edit option on the conncetion where you want to organize or edit your catalog. An option menu will pop up. Click on organize from the option menu.
This will take you to organize page, where you can organize or edit your catalog. When you are in the organize page you will see two containers. Container on the left hand side displays the data tables from the source you have connected. Container on the right hand side represents the data catalog.
If you want to remove a table or a column from the catalog, hover over the name of the table or the column from the catalog container on the right hand side. Click on the delete icon to remove the data from the catalog. Clik on save and continue to save changes to your catalog.
Your catalog is now saved to be viewed in the graphbuilder.
Delete a catalog
To delete a catalog, from the organize page, simply hoever over the name of the catalog. A delete icon will appear. Click on the delete icon to delete the catalog.
Multi-catalog support
This feature enables users to toggle between multiple catalogs when creating data visualizations, based on their role and permission levels. This functionality is useful for:
Enhanced Flexibility: Users can seamlessly switch between different catalogs, enabling the exploration and comparison of diverse datasets.
Tailored Insights: By accessing multiple catalogs, users can derive more insights and make data-driven decisions that are specific to their needs and objectives.
Streamlined Workflow: With all relevant data conveniently accessible within a single dashboard, users can streamline their workflow, saving time and effort in gathering and integrating data from various sources.
Improved Collaboration: Multiple catalog access helps in collaboration among team members, allowing them to share and work with data from different catalogs.
Increased Efficiency: The ability to toggle between catalogs removes the need for users to switch between multiple tools or platforms, increasing efficiency and productivity in data visualization.
While creating visualizations, you can toggle between different catalogs by simply clicking the arrodropdown icon on the catalog and choose the catalog you want to use.
How to add multiple catalogs?
When you are adding a new connection, once you have completed the steps of selecting, connecting and adding meta data to your data and click on save and continue, you will see the option to organize your data into a catalog.
Click on the add catalog icon to add a new catalog. Click on the pen icon to give a name to your new catalog. Click on the dropdown, you can see the new catalog is added to the catalog list.
Now you can drag and drop data from sources to the new catalog to organize the catalog. After adding data if you click on save, your new catalog will be saved.